Guest Contributor: Patrick Meany
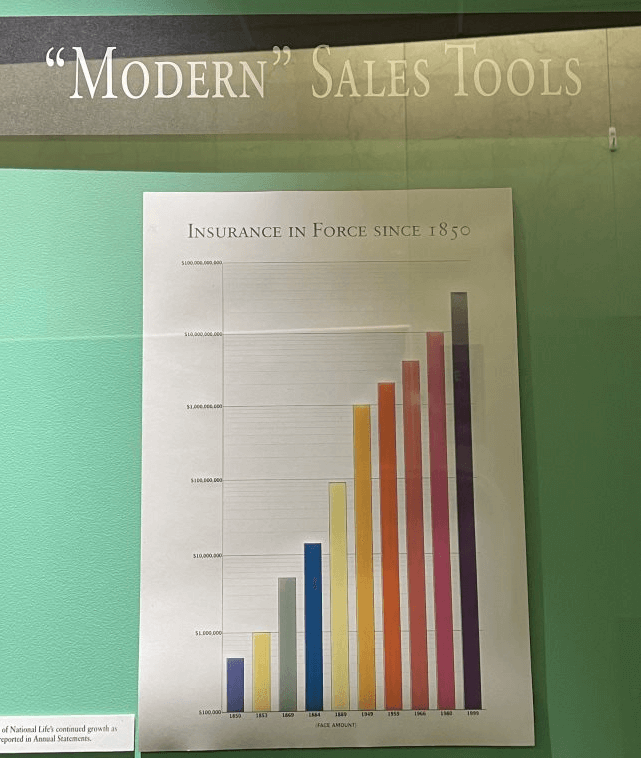
Have you ever seen this graph?
For those who haven’t seen this, it’s in the historical display on the first floor of the Vermont Campus.
The number referenced represents the total amount of life insurance coverage National Life has on the books. Important to note that this is different than sales (which represent the money National Life receives). This number is a dollar representation of all the promises National Life has made to our customers. The display graph cuts out in 1999, when our total promises were around $27 billion. We thought it was time for an update, and in Q1 of 2023 we passed a pretty impressive milestone.
As of March 31, 2023 our total promises exceed:
$300,000,000,000!
You read that right! The coverage to our customers is more than 10x larger than it was 23 years ago. In fact, we only crossed $100 billion in 2016, so in the past seven years our coverage provided to customers has tripled!
This is one of many metrics that show the incredible growth that we have experienced. And it couldn’t be done without all of you. Thank you and congratulations!
*Details on the numbers: The official number is called “face in-force” and comes from our insurance exhibit report which is used to populate the blue book. For more questions on the data feel free to reach out to Patrick Meany or Kathy Laughlin.